The Ministry of Ecology and Environment reported the national ambient air quality in February and January-February.
CCTV News:According to the WeChat WeChat official account news of the Ministry of Ecology and Environment, the Ministry of Ecology and Environment informed the media of February and January 2023 & mdash; National ambient air quality in February.
air qualityOverall situation
In February, the average number of days with excellent air quality in 339 cities at prefecture level and above was 83.1%, down 8.3 percentage points year-on-year; The average number of days with severe pollution and above was 1.7%, up 0.6 percentage points year-on-year; The average concentration of PM2.5 was 46 μ g/m3, up 24.3% year-on-year; The average concentration of PM10 was 71 μ g/m3, up 29.1% year on year. The average concentration of O3 was 104 μ g/m3, up 6.1% year-on-year. The average concentration of SO2 was 10 μ g/m3, up 11.1% year on year. The average concentration of NO2 was 28 μ g/m3, up 27.3% year-on-year; The average concentration of CO was 1.1 mg/m3, up 10.0% year-on-year.
1— In February, the average number of days with excellent air quality in 339 cities at prefecture level and above was 78.5%, down 3.4 percentage points year-on-year; The average number of days with severe and above pollution was 3.6%, up 1.4 percentage points year-on-year; The average concentration of PM2.5 was 51 μ g/m3, up 8.5% year-on-year; The average concentration of PM10 was 79 μ g/m3, up 19.7% year on year. The average concentration of O3 was 99 μ g/m3, up 6.5% year on year. The average concentration of SO2 was 10 μ g/m3, which was the same as that of the previous year. The average concentration of NO2 was 27 μ g/m3, up 3.8% year-on-year; The average concentration of CO was 1.2 mg/m3, down 7.7% year-on-year.

Figure 1 2023 1-mdash; Proportion of days at all levels in 339 cities at prefecture level and above in February.
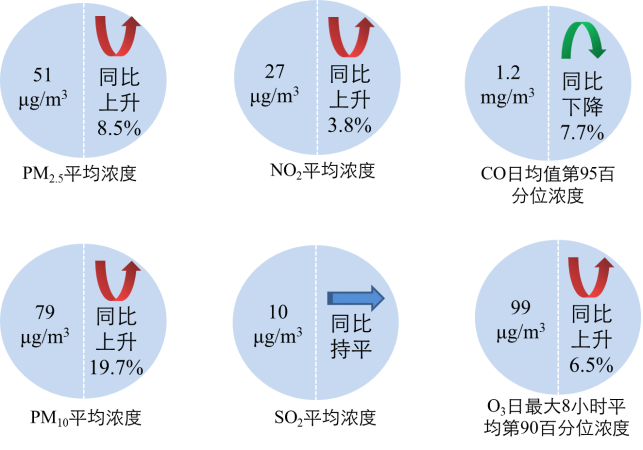
Figure 2 1-mdash in 2023; Concentration and year-on-year change of six indicators in 339 cities at prefecture level and above in February.
Key areas
(1) Beijing-Tianjin-Hebei and surrounding areas
In February, the average number of excellent days in "2+26" cities in Beijing, Tianjin and Hebei and its surrounding areas was 57.9%, down 27.8 percentage points year-on-year; The average proportion of days with severe and above pollution was 4.4%, up 4.4 percentage points year-on-year; The average concentration of PM2.5 was 71 μ g/m3, up 47.9% year-on-year; The average concentration of O3 was 97 μ g/m3, down 4.0% year-on-year. Cities with heavy and above pollution days are Anyang, Puyang, Zhengzhou and other cities. 1— In February, the average number of excellent days was 56.9%, down 6.0 percentage points year-on-year; The average number of days with severe and above pollution was 8.0%, up 3.6 percentage points year-on-year; The average concentration of PM2.5 was 74 μ g/m3, up 8.8% year-on-year; The average concentration of O3 was 91 μ g/m3, down 3.2% year-on-year.
The proportion of excellent days in February in Beijing was 67.9%, a year-on-year decrease of 32.1 percentage points; The concentration of PM2.5 was 54 μ g/m3, up 145.5% year on year. O3 concentration was 79 μ g/m3, up 2.6% year-on-year. No serious or above pollution days. 1— In February, the proportion of excellent days was 81.4%, a year-on-year decrease of 10.1 percentage points; The concentration of PM2.5 was 42 μ g/m3, up 23.5% year-on-year; O3 concentration was 75 μ g/m3, down 1.3% year-on-year.
(2) Yangtze River Delta region
The average number of excellent days in 41 cities in the Yangtze River Delta in February was 92.2%, down 1.5 percentage points year-on-year. There were no serious and above pollution days, which was flat year-on-year; The average concentration of PM2.5 was 40 μ g/m3, down 2.4% year-on-year; The average concentration of O3 was 98 μ g/m3, down 10.1% year-on-year. 1— In February, the average number of excellent days was 85.6%, up 7.0 percentage points year on year; The average number of days with severe and above pollution was 1.1%, up 0.6 percentage points year-on-year; The average concentration of PM2.5 was 47 μ g/m3, down 9.6% year-on-year; The average concentration of O3 was 99 μ g/m3, which was the same year-on-year.
(3) Fenwei Plain
The average number of excellent days in 11 cities in Fenwei Plain in February was 42.9%, down by 24.0 percentage points year-on-year. The average number of days with severe and above pollution was 8.8%, up 8.8 percentage points year-on-year; The average concentration of PM2.5 was 88 μ g/m3, up 41.9% year-on-year; The average concentration of O3 was 94 μ g/m3, down 5.1% year-on-year. Cities with more days of severe and above pollution are Xianyang, Xi ‘an and Weinan. 1— In February, the average number of excellent days was 42.7%, down 6.0 percentage points year-on-year; The average number of days with severe and above pollution was 13.9%, up 8.5 percentage points year-on-year; The average concentration of PM2.5 was 91 μ g/m3, up 12.3% year on year. The average concentration of O3 was 89 μ g/m3, down 6.3% year-on-year.
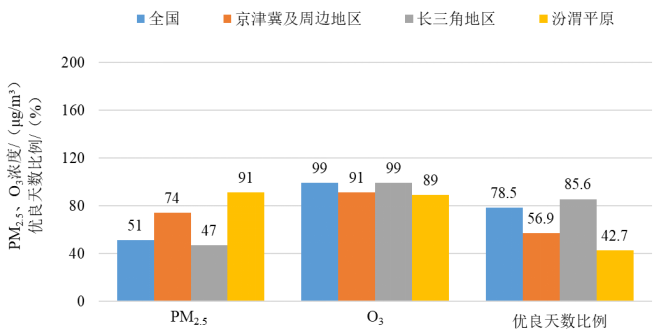
Figure 3 1-mdash in 2023; Comparison of air quality between China and key regions in February
Ranking of key cities
In February, among the 168 key cities, 20 cities, including Zhoushan, Haikou and Lhasa, had relatively good air quality (from 1st to 20th). The air quality in 20 cities, including Urumqi, Xianyang and Xi ‘an, is relatively poor (from the last one to the last 20), as shown in Table 1.
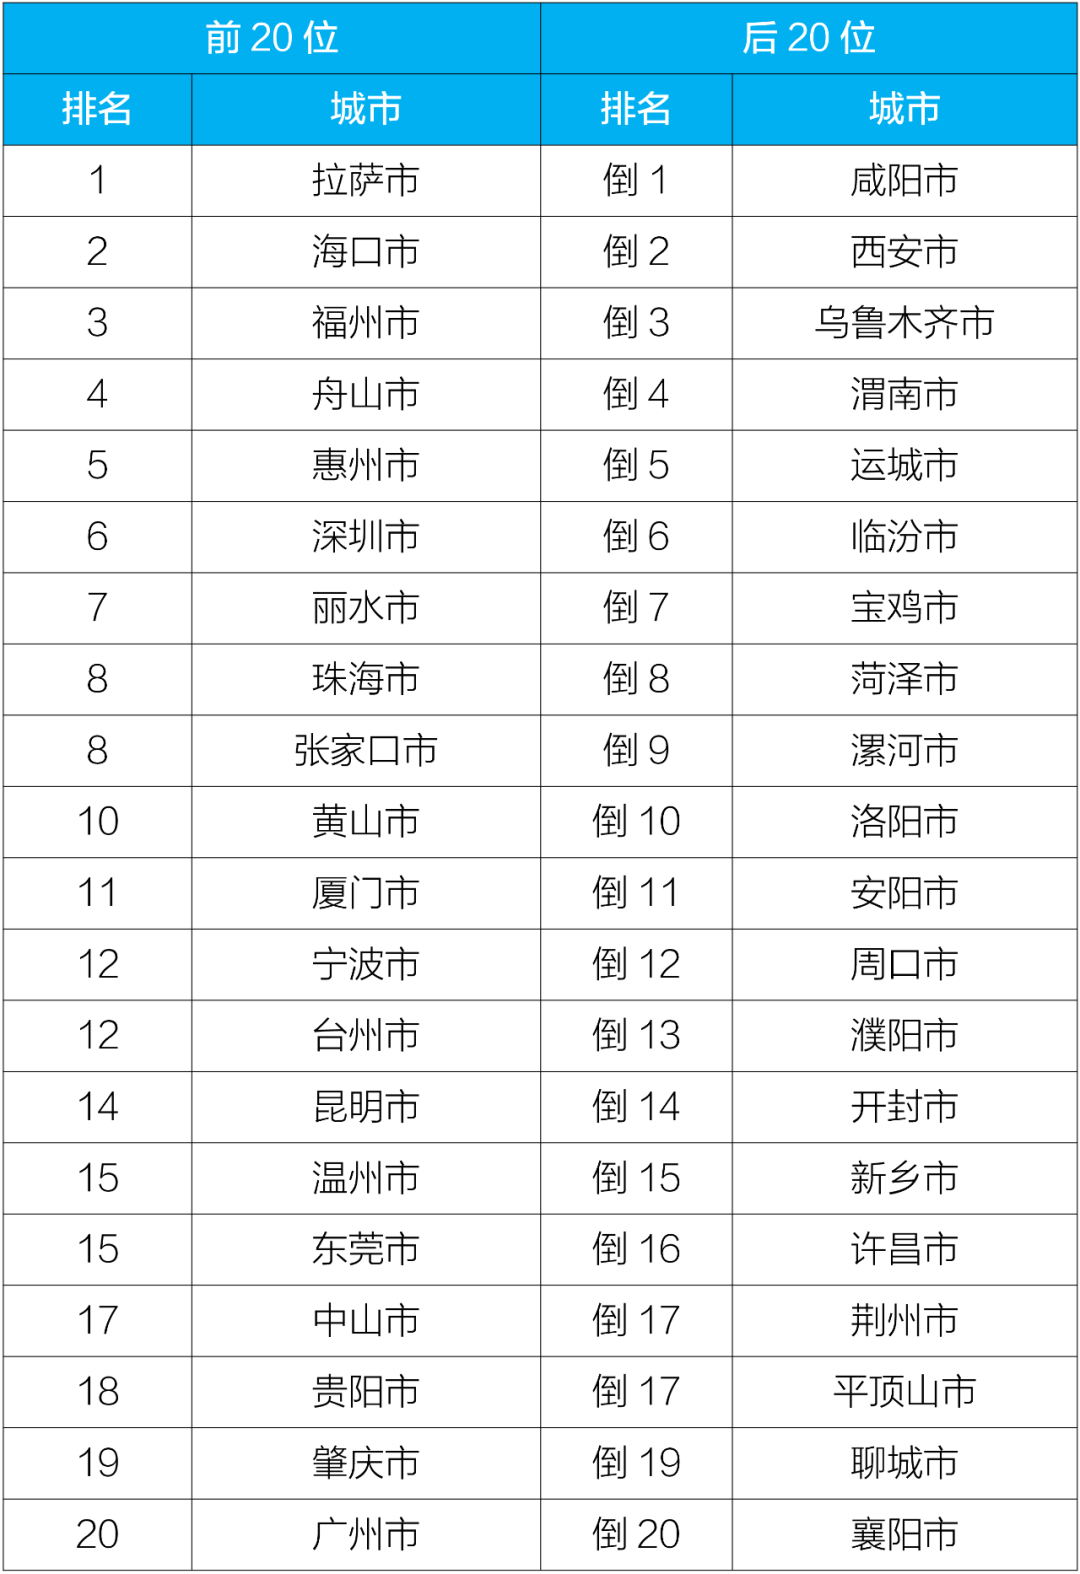
1— In February, among the 168 key cities, 20 cities such as Lhasa, Haikou and Fuzhou had relatively good air quality (from 1st to 20th). The air quality in 20 cities, including Xianyang, Xi ‘an and Urumqi, is relatively poor (from the last one to the last 20), as shown in Table 2.
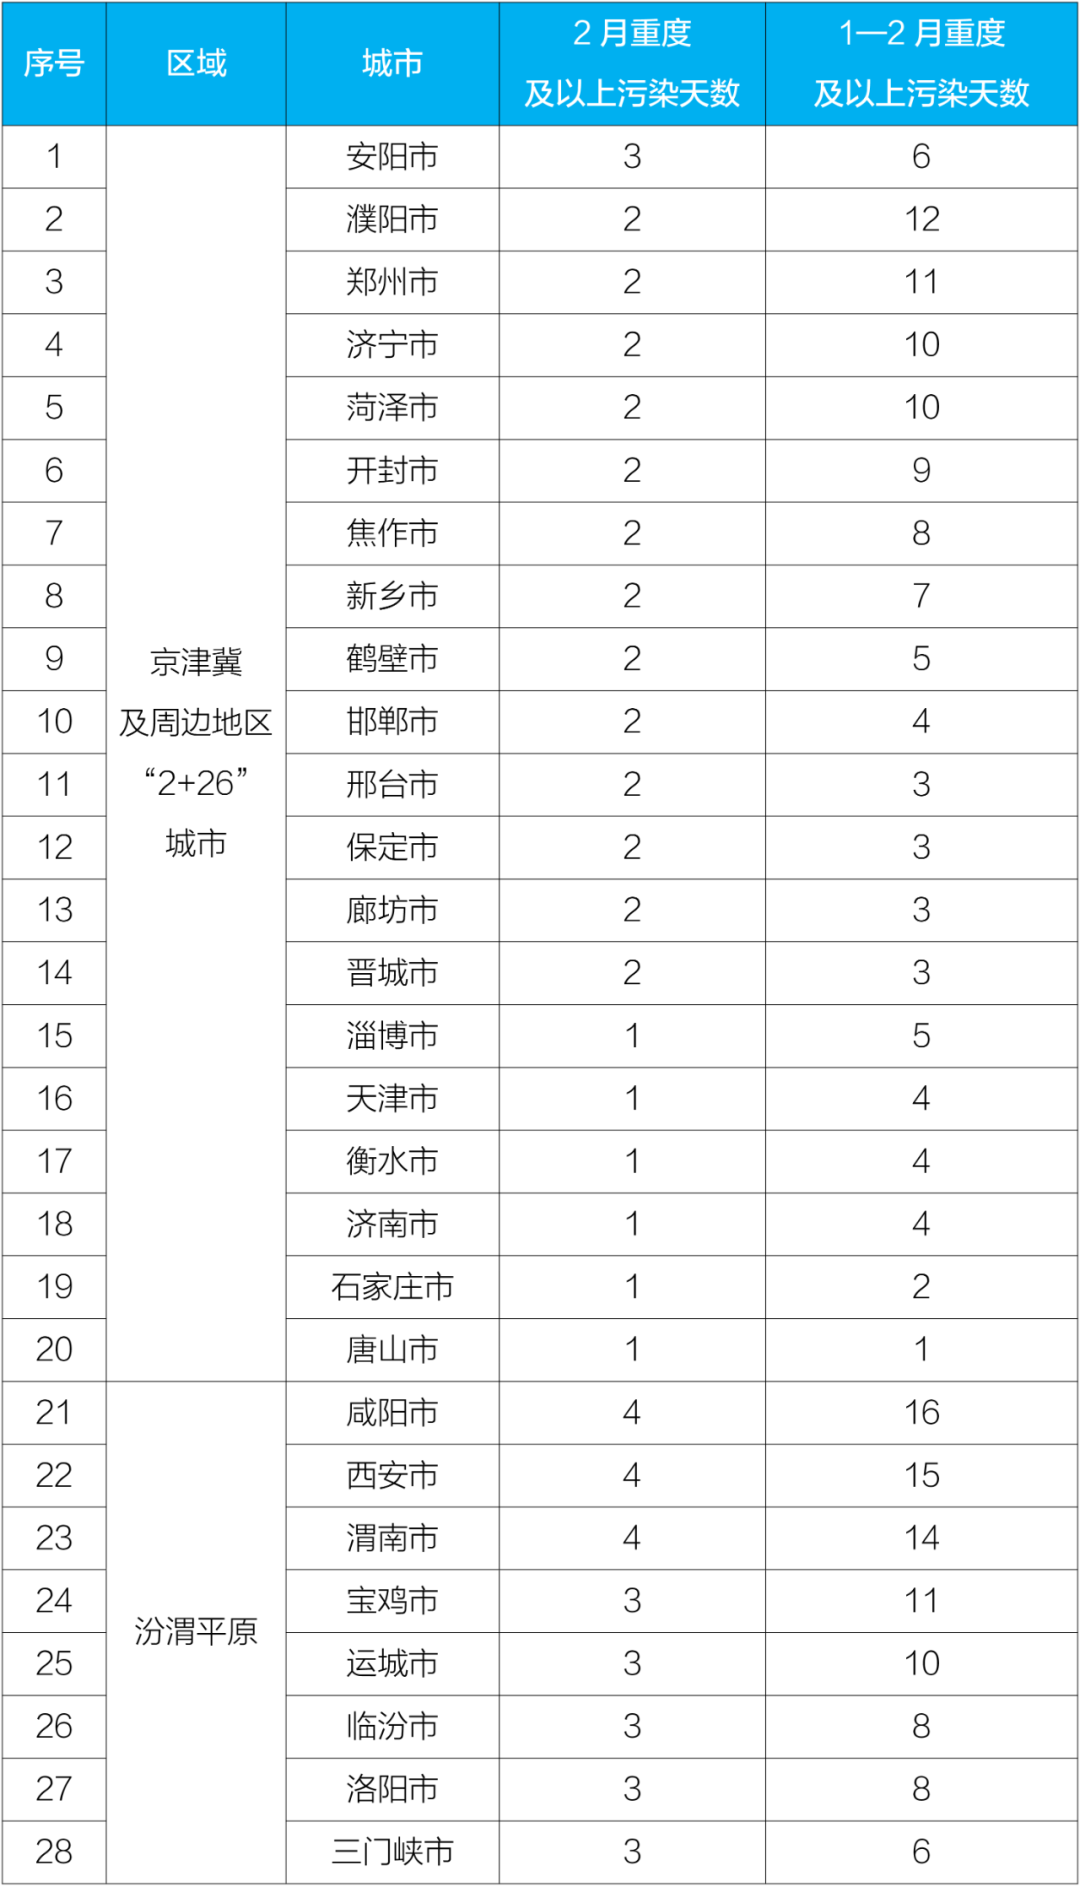
February and 1— See Table 3 for the cities and specific days with severe and above pollution days in key areas in February.
Schedule 1
Air quality in 168 key cities in February 2023
List of top 20 and bottom 20 cities
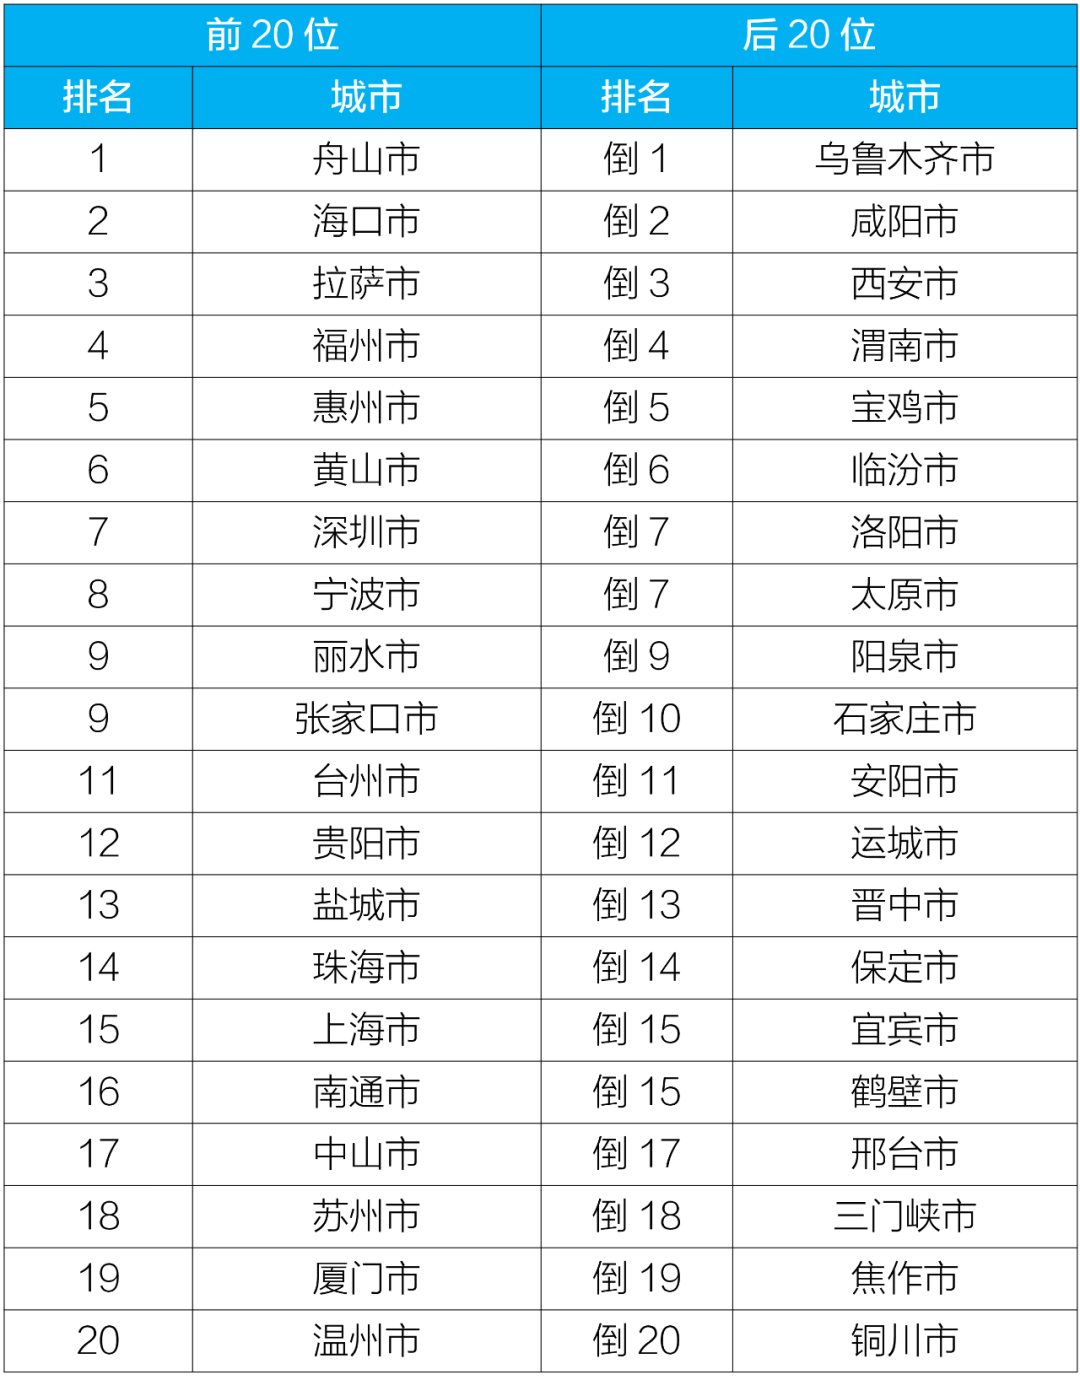
Schedule 2
1-mdash in 2023; Air quality in 168 key cities in February
List of top 20 and bottom 20 cities
Schedule 3
February 2023 and 1— February
List of cities with severe and above pollution days in key areas